top of page
space_encyclopedia_background.png

Welcome to SPACEdi's space encyclopedia profile for {objectName}. Our data engine provides object-specific articles, physical property tables, and exploration history overviews, connecting space enthusiasts, academy students, and scientific researchers to catalog imagery, structural planetary dimensions, and interactive 3D solar system models.

​

Platform Overview & Interactive Data Profiles:

​

Engineered by ARCHIMEDES Aerospace, this element bridges telemetry and ephemeris datasets with an immersive canvas interface for {Object_Name}. The interactive sandbox features:

​

  • Comprehensive Scale View: Investigate atmospheric layers, bulk composition, and surface features.

  • Voyage Planning Simulator: Deploy custom spacecraft objects to model complex orbital trajectories.

  • Integrated Scientific Engine: View related systems, natural satellites, and historical mission data from NASA, JPL, and ESA.

​

The platform supports flexible user levels—from free guest controls to saved personal libraries and academic integrations.

space_encyclopedia_background.png

Jupiter L5 Trojan cloud

belt region · Sun · Following Jupiter around the Sun.
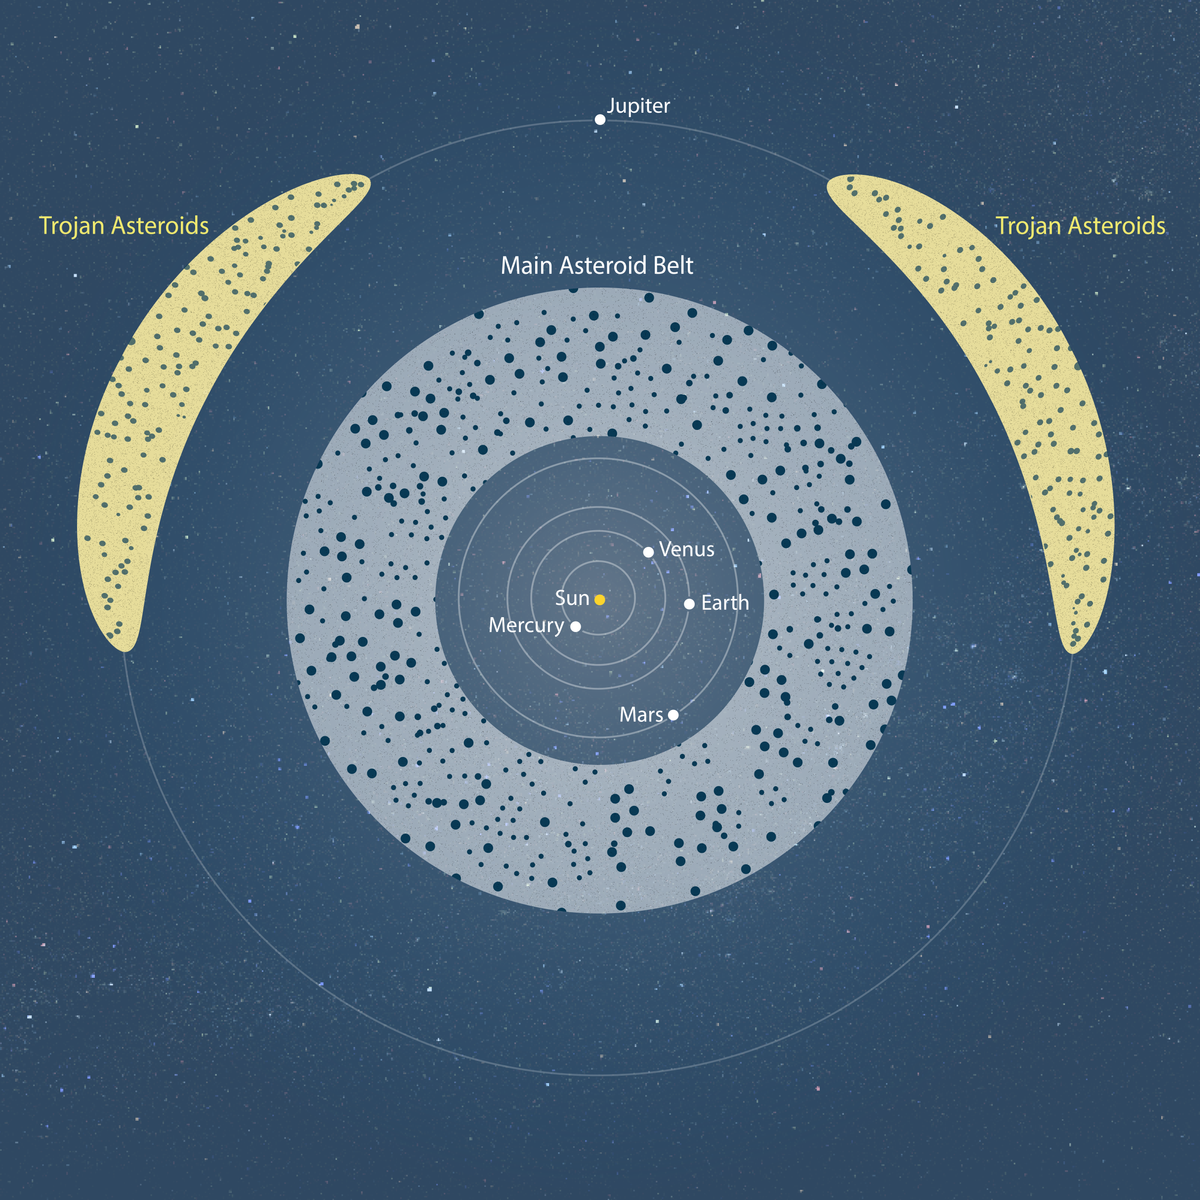
Jupiter L5 Trojan cloud — location relative to Jupiter

Discover the Trojan asteroid population near the region roughly 60 degrees behind Jupiter, then explore its place on the map on the SPACE-di interactive map.

View Jupiter L5 Trojan cloud in the 3D Solar System

Overview

Jupiter L5 Trojan cloud is a belt region in the Solar System, our region of space within the universe. The Sun is the star at the centre of this system. Explore its story and place in our planetary neighbourhood, then find it on the interactive 3D space map.

Jupiter L5 Trojan cloud — This swarm orbits the Sun approximately 60 degrees behind Jupiter, near its L5 Lagrange region. These asteroids share Jupiter’s orbital period but are not moons of Jupiter. Silicate minerals are observed on their dark surfaces; rock and water ice are expected in their interiors, while exposed surface ice is not established across the population. Dark grey and reddish colours represent surface diversity, not measured material fractions. The cloud and particle sizes and motion are illustrative.

bottom of page